Multiparameter flow cytometry is an important tool for biomedical scientists, especially for preclinical drug and vaccine research. It is an invaluable tool for detailed analysis of receptors, signaling, and effector molecules as well as nucleic acids in individual cells and cell populations. Technological advancements have made it possible to design and execute flow cytometry studies that simultaneously evaluate multiple parameters. However, evaluating multiple parameters at the cellular level is not an easy task. Below are some sample preparation, panel design, and data analysis aspects for new and inexperienced flow cytometry users to consider.
1. Sample Preparation
Sample preparation is critical for the success of flow cytometry. Cell density should be in the range of 105–107 cells/ml and flow rate should be 2,000–20,000 cells/second. Cell numbers are critical for data analysis. Too few cells will result in high variability of results and arbitrary gating. Too many cells will lead to signal saturation and loss of the possibility of nuanced subpopulation analysis. To prevent clumping, which will clog the instrument, the extraction protocol must be optimized to reduce cell aggregation and cell death.
For optimal results, cell samples should be as fresh as possible. The time between tissue harvesting, processing, and analysis should be kept to a minimum to avoid cell death and artifact accumulation. The samples should include cells for viability and tissue specificity controls.
2. Panel Design
Each additional dye in your panel will increase the chance of signal overlap (spillover) and potentially decrease sensitivity. Choose the fluorophores with minimal spillover and use the minimum number of dyes possible.
Use programs to model the spectral overlaps and spread out the fluorophores across the detectors. To avoid oversaturation and improve detection of rare markers, pair bright fluorophore labels with low-abundance antigens and dim fluorophore with highly expressed antigens. Furthermore, increasing the forward scatter threshold can be a successful gating strategy for the highly abundant markers.
Antibody affinity for ligands and non-specific binding can vary, especially in different batches of polyclonal antibodies. For reliable and reproducible data across experiments, each antibody should be accurately titrated. Titrate antibodies, starting with the recommended concentraion. Perform serial dilutions and check for antibody interactions and general precipitation. Viability dyes, such as DAPI which bind free DNA, can be used to differentiate false signals from dead or damaged cells.
3. Data Acquisition: good vs. bad data
The quality of flow cytometry data depends on experimental parameters that effectively distinguish between the valid data and artifacts. Data acquisition should include:
- Gating to select the appropriate area on the scatter or histogram plot to identify signals from cell(s) of interest. The parameters for gating include cell size, markers, and positive control.
- Compensation to correct emission spectra overlap between fluorophores. A well-designed panel will require the less arduous compensation strategy.
- Voltage walking to identify the ideal voltage setting to amplify dim signals above the background without exceeding the upper range of detection. Refining the voltage will separate real signal from the background noise. This will ensure voltage is directionally proportional to the fluorescence of cells passing through the detector.
4. Data Analysis: What can your plot tell you?
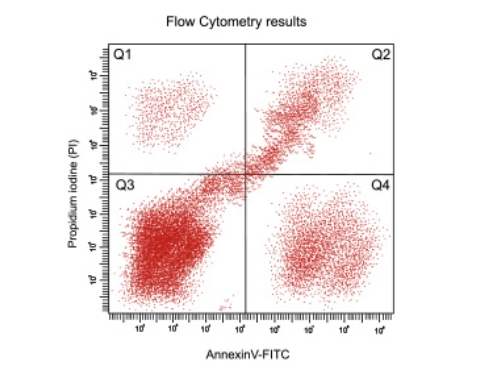
Analyzing the large amount of flow cytometry data generated can be challenging. Data visualization is a key part of flow cytometry data analysis. For example, with traditional logarithmic scaling visual space channels can get compressed. This helps visualize the upper ranges but can miss the low ranges of the log scale. Experimental analysis from a biexponential scale will compress the scale in the lower ranges and permits better visualization of high and low intensity fluorescence signals. Best practices for improved visualization and data analysis include:
- Plot your data before applying statistics
- Set the null hypothesis– what the results would look like when there is no difference between control and experimental samples– at the beginning. This defines what is being tested and avoids waiting “to see what the data shows.”
- Use the null hypothesis to select the correct statistical test required to support or disprove the hypothesis.
- Set objective and accurate threshold levels. Threshold should be set low enough to capture the entire population being analyzed but avoid electronic noise from the channel. This is especially important when evaluating rare events.
- Use statistical software for comprehensive and advanced statistical analysis of the resulting data. There are a variety of commercially available applications but they can cost hundreds to thousands of dollars. If you do not have access to paid licensing, a contract service provider is a time- and cost-effective option to consider.
Explore our antiviral & antibacterial testing services

